Disclosure: this post was written with the assistance of an AI system (Claude), which wrote the analysis code, ran the experiments and drafted the text. The topic, the constraints, the data choices and the final review are the author’s.
Under Korea’s jeonse system a tenant hands the landlord a lump sum worth half to four fifths of the home, pays no monthly rent for two years, and receives it back at the end. It is a secured loan, and secured loans have a safety margin you can compute: how far the home can fall before the deposit stops being fully covered. It is the deposit plus any registered mortgage, divided by what that kind of property fetches at a court auction — two figures Korea publishes monthly, and a number that appears on no contract. For a Seoul apartment at January 2026 ratios it is about 50%. For a Seoul villa at December 2022 ratios it was under a point. This post works out how to compute it, how much of it is arithmetic and how much is modelling, and the one mechanism it misses entirely.
A contract with a number missing
Korea has a rental arrangement that exists nowhere else at scale. Under jeonse, a tenant hands the landlord a lump sum — commonly half to four fifths of what the home is worth — lives there for two years paying no monthly rent at all, and receives the whole sum back at the end.
It is easy to call this strange and much harder to call it bad. For decades it did several useful things at once: it turned savings into housing without a mortgage, it forced saving in a way monthly rent does not, and it was the standard rung between renting and owning. Millions of households hold most of their net worth in one right now.
It is also, unavoidably, a secured loan from tenant to landlord — and secured loans have a quantity any lender asks for before signing: the safety margin, how far the collateral can fall before the loan stops being fully covered. Korea publishes both numbers you need to compute it. It appears on no contract and in no listing.
This post works it out: what the margin is, how much is arithmetic and how much is modelling, and the one mechanism it misses entirely.
The margin is two published ratios divided
Write D for the deposit, M for any mortgage registered ahead of it, V_T for
what the home is worth when the lease ends, and lambda for the fraction of
appraised value that kind of property fetches if it has to be sold at a court
auction. The tenant’s claim pays
min(D, max(0, lambda · V_T − M))
which is fully covered as long as the home is worth at least
V* = (M + D) / lambda
Note what is not in that expression: no volatility, no expected return, no horizon, no model. The deposit ratio is 전세가율 — deposit over sale price. The liquidation ratio is 낙찰가율 — winning bid over appraised value, published monthly by building type and district.
Two worked examples, with M = 0 so nothing else is in the way:
Seoul apartments at January 2026 ratios. Deposit ratio 50.92% — an all-time low since the series began in 2013, not because deposits fell but because sale prices ran ahead of them. Seoul apartments cleared 101% of appraisal at auction in July 2026, a fourth straight month above par. Margin: 49.6%.
Seoul villas at December 2022 ratios. Villas — 연립·다세대, much of the affordable rental stock — had a deposit ratio of 78.6%, and Seoul villas clear 79% at auction. Margin: 0.5%. By December 2024 the ratio had come down to 65.4%, which puts the same calculation at 17.2%.
Two things about the distance between those, because the obvious way to describe it is wrong twice over.
First, it is two ratios moving, not one. Of the 49 points, the deposit ratio accounts for 27.4 and the auction clearing ratio for 21.7. Move the deposit ratio alone and the margin goes to 22.2%, not to under a point. Building type matters through both channels, in roughly equal measure.
Second, resist dividing. Fifty over a half is “a factor of a hundred” and means nothing here: the margin is exactly linear in the deposit ratio — every point of ratio costs 1.27 points of margin, at every ratio, which is why Fig 1 is three straight lines — so a ratio of two of its values is large only because one sits near zero. The honest statistic is the difference in points.
None of which makes this clever. It is division, worth doing because the answer is specific to your building and nobody hands it to you.
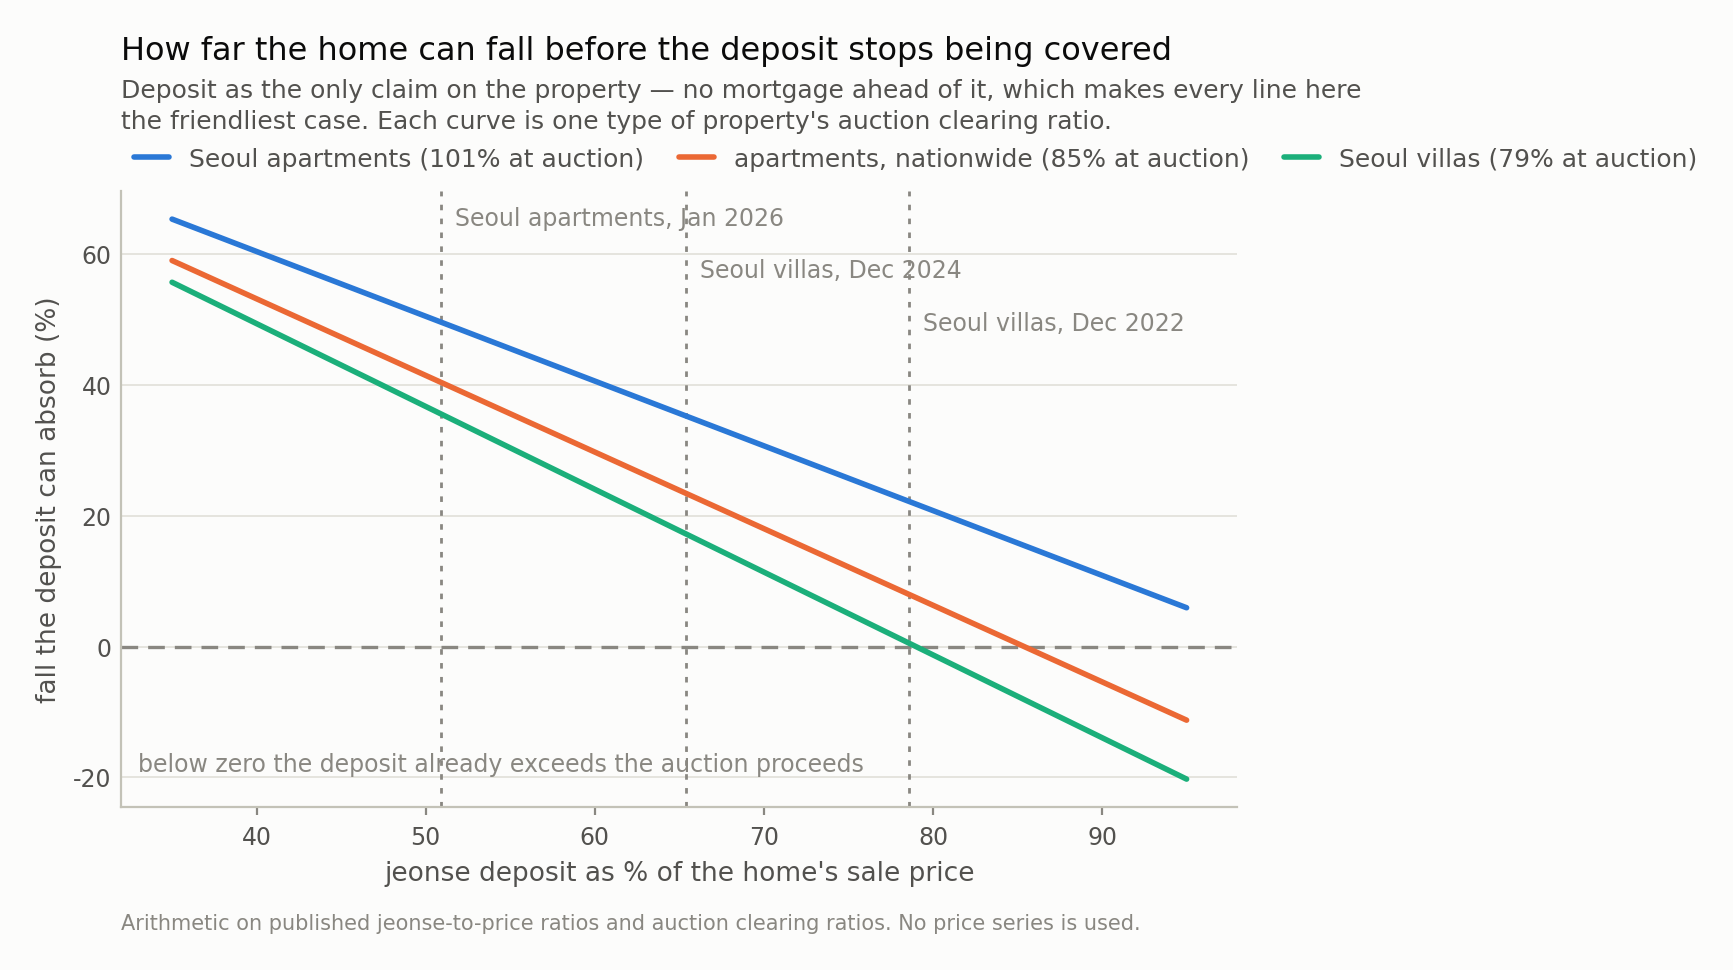
Fig 1. No model in this chart — it is (deposit + mortgage) / auction ratio and nothing else. At January 2026 Seoul apartment ratios the margin is 50%; at December 2022 Seoul villa ratios it was 0.5%. The lines are straight because the margin is linear in the deposit ratio, so read the vertical gap in points rather than as a ratio — and note that the two cases differ in the auction ratio as well, by 21.7 points of the 49.
The margin is not the risk
Knowing how far the home can fall is not the same as knowing how likely that is, and for the second question a model has to be admitted. Mine is thin on purpose: lognormal terminal value, zero drift, two-year term, one volatility parameter.
That parameter is the interesting choice. House price indices are quiet — Giacoletti’s work on repeat sales puts metropolitan index volatility at 4-5% a year. But a tenant is exposed to one building, not an index, and the same paper measures idiosyncratic volatility for individual homes at 10-18% a year. Reading this risk off an index number understates it three- to fourfold, which is probably the most transferable point here.
At 12% a year over a two-year term, the January 2026 Seoul apartment case breaches its margin with probability 0.00% and loses 0.0001% of the deposit a year in expectation; the December 2022 Seoul villa case, 52% and 3.26%.
Here the two halves of the calculation behave completely differently, and it is worth being precise. The margin is linear. The loss is convex. Fig 1 is a straight line; Fig 2 spans four orders of magnitude across the same range. That convexity is a property of the payoff, not of my parameters: a claim far below its threshold is nearly riskless, one sitting at its threshold is nearly all risk, with no gentle middle. Which is why “the deposit ratio went up a few points” is not a mild sentence, even though the margin moved only a few points too.
Every case, side by side — the first three columns published or arithmetic, the last two modelled:
| cohort | deposit ratio | auction ratio | fall needed | P(breach) | spread covers |
|---|---|---|---|---|---|
| Seoul apartment, Jan 2026 | 50.9% | 101% | 49.6% | <0.1% | >1,000x |
| Seoul, all housing, 2025 | 57.0% | 101% | 43.6% | <0.1% | >1,000x |
| nationwide, all housing, 2025 | 65.0% | 85% | 23.9% | 6.4% | 17x |
| Seoul villa, Dec 2024 | 65.4% | 79% | 17.2% | 15.2% | 6.0x |
| Seoul villa, Dec 2022 | 78.6% | 79% | 0.5% | 52.2% | 1.1x |
(The integral is easy to get wrong, so every row is checked against a 400,000-draw Monte Carlo. Largest disagreement: 0.0074 percentage points. The margin is also computed twice by different code paths and asserted equal, which is how I caught a unit slip that had already shipped one broken chart.)
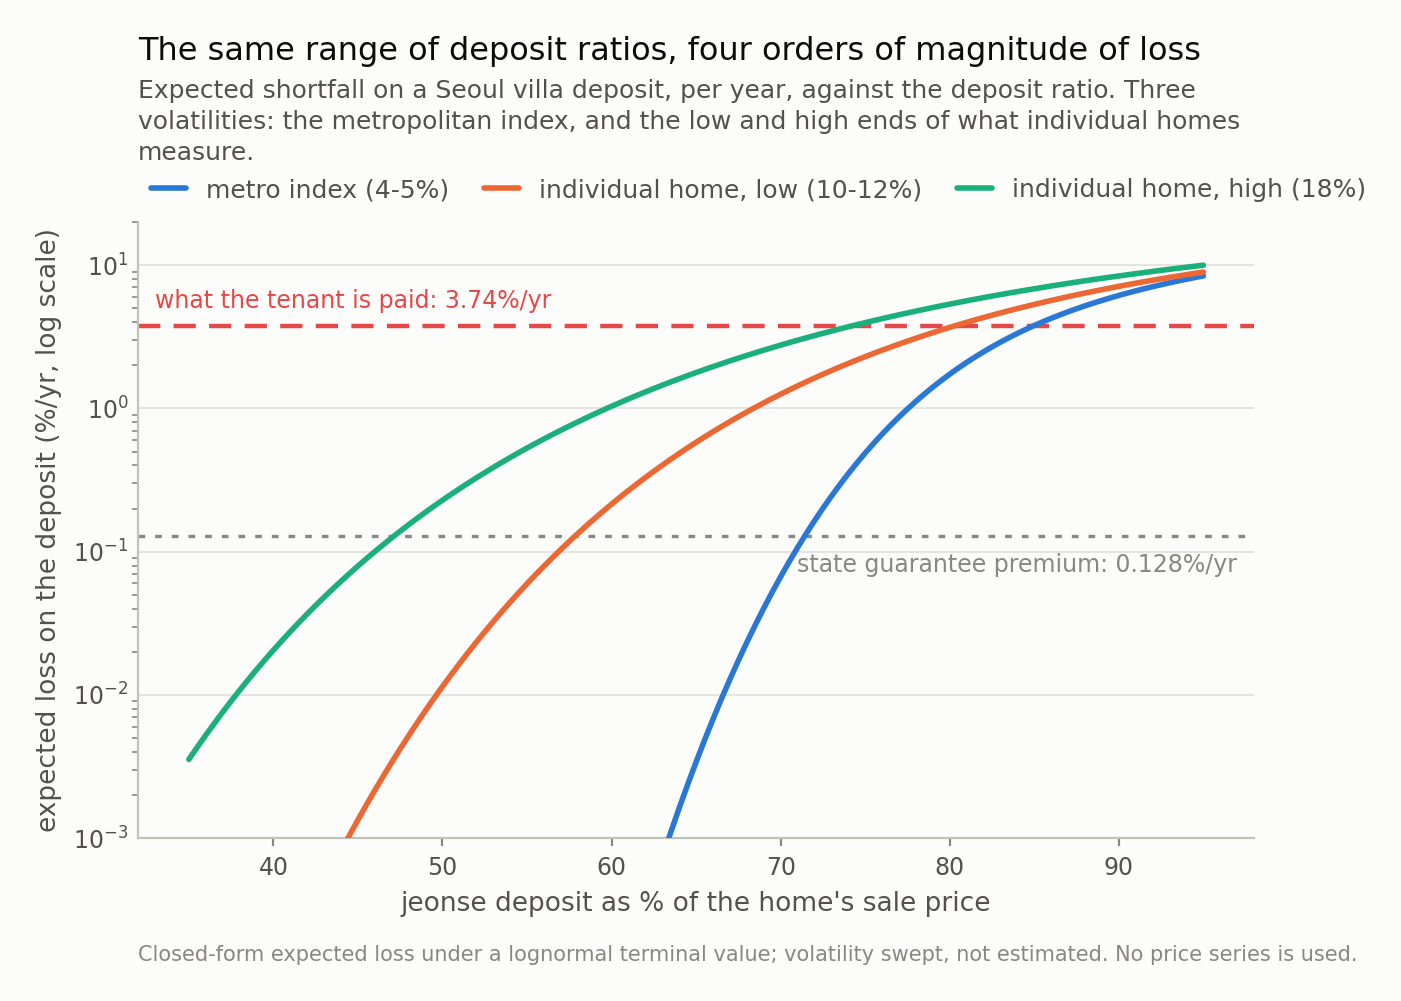
Fig 2. Between a 55% and an 80% deposit ratio the expected loss rises by roughly four orders of magnitude, while the margin in Fig 1 falls by about thirty points in a straight line. That is what convexity looks like: the same contract, a claim moving from far below its threshold to sitting on it. The reference lines mark the in-kind return net of the Base Rate (3.74%/yr) and the guarantee premium (0.128%/yr), for scale.
What the deposit earns
The tenant is not lending for nothing. The return is paid in kind — a home occupied rent-free — and Korea publishes the market price of that swap: the 전월세전환율, the rate at which a deposit converts into monthly rent. In June 2026 it was 6.06% for Seoul and 6.62% nationwide, a record for the series.
Net of what the money would otherwise earn — the Base Rate is 2.75% after July’s increase — that is roughly 3.9% a year, and about 3.7% after a deposit-return guarantee premium of 0.128%. For readers who think in credit terms: at the loss rates above, that is a comfortable multiple of expected loss in the apartment case and roughly one times it in the December 2022 villa case.
The observation I would draw is narrow, and I want to keep it narrow. The conversion rate is essentially one national number; the margin is building-specific, and across Table 1 it runs from fifty points to under one. That is not evidence anyone was cheated — deposit ratios are negotiated, tenants have preferences over building and location, and much besides risk goes into what a home rents for. It does mean the price is not where you look to find out how safe a deposit is. The margin is, and the margin is free.
As for what margin is reasonable, the market has a rough convention: analysts describe deposit ratios of 60-70% as the band where jeonse and sale prices sit in stable balance. Table 1 lets you turn any ratio into a breach probability at a volatility you choose, which is more use than a band.
Three ways to check the arithmetic
A claim built on a mechanism should come with ways to switch the mechanism off. This one has three, and the second changed what I thought the answer was.
Take volatility to zero. If prices never move, a claim below its threshold never breaches, so the loss in Fig 2 is all option value. The exception is the December 2022 villa ratio, where the control cannot bite: that case sat 0.51% from its threshold, and at a volatility of 0.2% a year — two orders of magnitude below any housing market ever measured — the breach probability is still 3.6%, because half a point is under two standard deviations even then. At 2% it is 43%, at 12% 52%, at 18% 54%. So the control passes everywhere except at the ratio that mattered most, and there it says something the model cannot: at that margin, volatility is not what determines the outcome.
Take the liquidation haircut away. Hold the deposit ratio at 78.6% and let the property sell at full appraised value instead of 79%. Expected loss falls from 3.26% a year to 0.34% — a factor of 10. I did not expect that, and it moves the emphasis. Most of the modelled loss is not the price falling; it is the 21-point gap between what a villa is appraised at and what a court realises for it. Appraisal and liquidation are a different problem from market risk, and the second is the one that gets discussed.
Put a mortgage back in. Every figure above assumes none, which makes them upper bounds rather than estimates. A senior lien takes the January 2026 Seoul apartment case from 50% to 30% at a 20% mortgage and 10% at 40% — the single biggest reason to run this on your own building rather than a district average. The registered mortgage is on the 등기부등본, and it is yours to look up.
The mechanism the margin misses
Now the part where the arithmetic above is not enough, which is the most useful section here.
Korea had a great deal of difficulty with deposit refunds in 2023 and 2024 without anything deserving the word crash. For villas that fits Fig 1 — the margin was under a point. But apartments, whose margins were tens of points, also saw many refund problems, and the collateral arithmetic cannot explain those. I should not pretend it does.
There is a second mechanism, it is linear, and it arrives first. When a lease
rolls over the landlord returns D and collects a new deposit set by today’s
ratio and today’s price. Any difference is cash that has to come from somewhere
else, and it has nothing to do with whether the collateral covers the claim.
Do that arithmetic on the published villa ratios with no price move at all. They went from 78.6% to 65.4% between December 2022 and December 2024, so a landlord returning a deposit on a completely unchanged home had to produce 16.8% of it in cash; with a 10% price fall, 25.1%.
That is the shape of it. The collateral gap needs a large price move and is convex; the funding gap needs no price move, is a straight line, and there was a great deal of it. Whether a funding gap becomes a tenant’s loss depends on something no model here contains — whether the landlord could raise the difference — and in most cases they could.
It also cuts against reading the falling ratio as unambiguously good. Asking for a larger margin is the right response to a convex risk, and every tenant who did made the incumbent landlord’s refund arithmetic harder. Both are true at once, which is usually a sign a single number is being asked to carry a judgement it cannot.
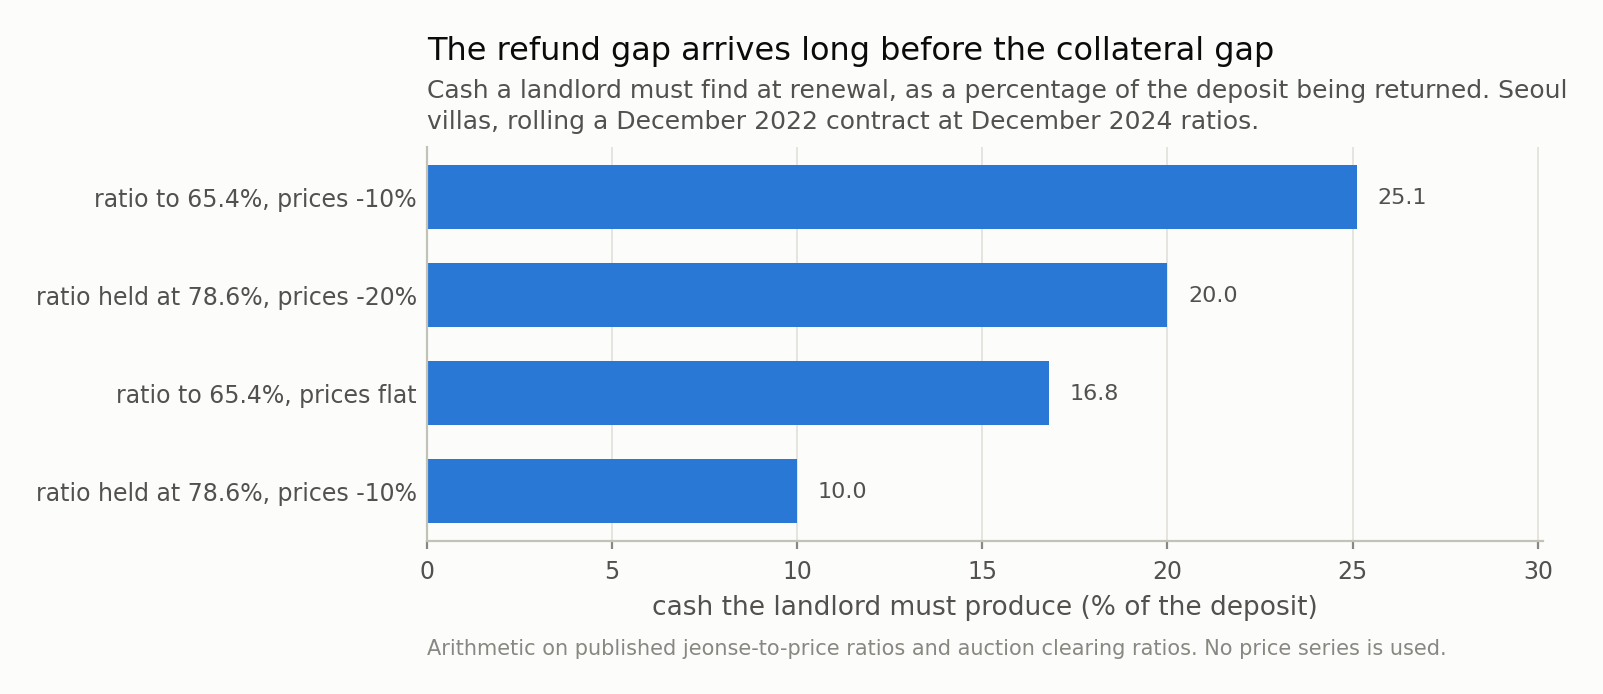
Fig 3. The ‘prices flat’ bar contains no price move at all. Seoul villa deposit ratios fell from 78.6% to 65.4% between December 2022 and December 2024, so a landlord refunding an unchanged house had to produce 16.8% of the deposit in cash. That is a funding problem, it is linear, and it starts at price moves an order of magnitude smaller than the ones Fig 1 is about.
Where this is a caricature
Lognormal, zero drift, one volatility. Real house prices are autocorrelated and skewed, volatility clusters, and two-year windows in Korea have been anything but drift-free in either direction. A jump or regime model would fatten the left tail and make every loss figure larger, which is the direction that does not rescue the conclusion.
Volatility does not scale the way I made it scale. Giacoletti’s other finding is that idiosyncratic house risk barely grows with holding period while index risk does, so my √T scaling understates one-year and overstates five-year risk. Small over the two-year term; not to be pushed further unfixed.
The auction ratio is not the tenant’s recovery. 낙찰가율 is the winning bid over appraised value, and appraisals are stale, contested and occasionally wrong. Real recovery also loses court costs, arrears and any tax lien that outranks the tenant, and it takes time. Every figure here is optimistic on that axis, which is another reason to treat the margin as a bound rather than a promise.
The loss numbers are the least useful part. An investor holding this kind of claim would hold a hundred and care about expected loss, because a portfolio average is what a portfolio delivers. A household holds one, and an average is not what it experiences. That is a fact about position size rather than pricing, and no expected-loss figure captures it — which is exactly why the number I would want before signing is the margin in Fig 1, not anything in Fig 2. It is exact, it is specific to the building, and it answers the question a household actually has.
Guarantee statistics, for scale only. HUG’s published figures: 11조 441억원 of deposit-return guarantee incidents across 50,941 cases over 2020-2024, 24,870 of them 다세대 against 13,251 apartments, 25% recovered on claims taken over. Setting that against premium income produces a large ratio and an earlier draft made something of it, but the pool is not the cohorts modelled here, recovery from landlords is not lien recovery, and a guarantee covers fraud, which nothing above prices. A sizing fact, not a verdict.
The ten-second version
If you take one thing from this, take the recipe.
(deposit + any registered mortgage) ÷ the auction clearing ratio for that building type and district. Subtract from one. That is how much the home can lose before your deposit stops being fully covered.
Every input is public and free. The deposit is on your contract, the registered mortgage on the 등기부등본, the auction clearing ratio published monthly by building type and district. And the answer differs enormously between two buildings that would look identical in a listing, which is the whole reason it is worth the thirty seconds.
Context, stated flatly because it is not my place to draw a conclusion from it. Jeonse’s share is falling: in June 2026 monthly rent took 54.1% of Seoul apartment rental transactions against 45.9% for jeonse, and listings were down 32.8% year on year. In July 2026 the government said it would develop a proposal for a public body to hold deposits rather than landlords, with mechanism, participation and guarantee terms all undecided.
Whether any of that is good policy is a question my arithmetic has no standing to answer. What the arithmetic can do is put one specific, checkable number in front of someone before they sign — and there is no reason that number could not simply be printed on the contract.
Data
- Jeonse-to-sale-price ratio (전세가율) for Seoul apartments of 50.92% in January 2026, an all-time low since the series began in April 2013, breaking 50.87% of May 2023; Gangnam 37.7%, Songpa 39.4%, Yongsan 39.7%, Seocho 41.6% — KB부동산 monthly housing time series via 한국경제TV, 27 January 2026, https://www.wowtv.co.kr/NewsCenter/News/Read?articleId=A202601270233.
- Seoul villa (연립·다세대) jeonse-to-price ratio of 78.6% in December 2022, 68.5% in December 2023 and 65.4% in December 2024 — 한국부동산원 임대차시장 사이렌 via 한경비즈니스, 27 January 2025, https://magazine.hankyung.com/business/article/202501271517b.
- Composite jeonse-to-price ratios of 65% nationwide, 57% for Seoul, 65% for Gyeonggi and 68% for Incheon as of August 2025 — KB부동산, quoted in iM증권, ‘From jeonse to monthly rent’, 8 September 2025, https://www.imfnsec.com/upload/R_E09/2025/09/%5B08074049%5D_251607.pdf.
- Auction clearing ratios (낙찰가율) for July 2026: nationwide apartments 85.4%, a 16-month low, and Seoul apartments 101.0%, a fourth consecutive month above 100%; Incheon 80.4%, Busan 78.8% — 지지옥션 July 2026 auction report via 뉴스핌, 6 August 2026, https://www.newspim.com/news/view/20260806000537.
- Seoul villa auction clearing ratio of 79% against 102% for Seoul apartments, with non-redevelopment villas routinely failing three or four rounds and selling at 41-50% of appraised value — 지지옥션 via 디지털타임스, https://www.dt.co.kr/article/12030827.
- Jeonse-to-monthly-rent conversion rate (전월세전환율) of 6.06% for Seoul in June 2026, the highest since the series began in January 2018, and 6.62% nationwide; COFIX at 3.05% in June 2026 — 한국부동산원 via 뉴데일리, 20 July 2026, https://biz.newdaily.co.kr/site/data/html/2026/07/20/2026072000203.html.
- Bank of Korea Base Rate raised 25bp to 2.75% on 16 July 2026 — Bank of Korea monetary policy decision, https://www.bok.or.kr/eng/bbs/E0000634/view.do?nttId=11062944.
- HUG 전세보증금반환보증 premium schedule of 0.097%-0.211% a year depending on term, building type and debt ratio, with an 80% debt ratio limit and apartment appraisal capped at 140% of market value — 주택도시보증공사, https://www.khug.or.kr/hug/web/ig/dr/igdr000001.jsp.
- HUG guarantee incidents of 11조 441억원 across 50,941 cases in 2020-2024, subrogation of 9조 4,189억원 across 43,631 cases, recoveries of 2조 3,458억원 for a 24% recovery rate; by building type apartments 13,251 cases / 3조 2,685억원, 다세대 24,870 cases / 5조 1,960억원, officetels 10,648 cases / 2조 1,802억원 — 뉴시스, 22 October 2025, https://www.newsis.com/view/NISX20251022_0003373232.
- HUG cumulative guarantee supply of 99조 3,914억원 for 2020-2023 and premium income of 3,525억원 from January 2020 to August 2024, described as 0.35% of the outstanding guarantee balance — 뉴스토마토, https://www.newstomato.com/readnews.aspx?no=1241569.
- Monthly rent at 54.1% of Seoul apartment rental transactions in June 2026 against 45.9% for jeonse (8,819 against 7,477 deals) — Seoul Metropolitan Government via 파이낸셜뉴스, 22 July 2026, https://www.fnnews.com/news/202607220822238116.
- Seoul apartment jeonse listings down 32.8% year on year to 17,116 from 25,943, and villa jeonse prices up 0.44% in April 2026, the largest monthly rise in 12 years and 7 months — 한국부동산원 via 헤럴드경제, https://biz.heraldcorp.com/article/10763783.
- Government announcement of 14 July 2026 on a public trust (‘안심신탁’) to hold jeonse deposits instead of landlords, with mechanism, participation and guarantee terms all still undecided — 한국경제, https://www.hankyung.com/article/202607217859O.
- Idiosyncratic volatility of individual house capital gains of roughly 10-18% a year against 4-5% for metropolitan indices — Marco Giacoletti, ‘Idiosyncratic Risk in Housing Markets’, Review of Financial Studies 34(8), 2021, 3695-3741, https://academic.oup.com/rfs/article-abstract/34/8/3695/6187964.
- No price series is used or redistributed. Every input above is a published scalar; everything else in this post is closed form or fixed-seed simulation.
Reproducibility
- seed: 20260804
- environment: standarderror=0.1.0, python=3.11.15, numpy=2.4.4, scipy=1.17.1
- attachment: the tenant receives min(D, max(0, lambda·V_T - M)), so the tranche attaches at (M + D)/lambda — no volatility, drift or horizon enters it
- bound: every headline figure sets M = 0, i.e. assumes no mortgage ranks ahead of the deposit, which makes the tenant’s risk a floor rather than an estimate
- loss: expected shortfall integrated in closed form against a lognormal terminal value over a two-year term, zero drift, volatility swept over [0.05, 0.12, 0.18]
- verification: Monte Carlo, 400,000 draws per cohort; largest disagreement with the closed form 0.0074 percentage points; the exact trigger and the modelled one are asserted equal at every cohort, which is what catches a unit slip between the two code paths
- decomposition: of the 49.1pp gap between the January 2026 Seoul apartment and December 2022 Seoul villa triggers, the deposit ratio contributes 27.4pp and the auction clearing ratio 21.7pp
- guarantee_experience: HUG’s 2020-2024 figures are quoted for scale only: 50,941 incidents, 24.9% recovered on claims taken over. The pool is not the cohorts modelled here, recovery from landlords is not lien recovery, and fraud is not priced above, so no comparison against premium income is drawn