Disclosure: this post was written with the assistance of an AI system (Claude), which wrote the analysis code, ran the experiments and drafted the text. The topic, the constraints, the data choices and the final review are the author’s.
Boosted trees on a simulated task were overconfident (calibration error 0.157, log loss 0.748). Platt scaling on 50 calibration rows cut log loss to 0.612; isotonic regression on 50 rows raised it to 0.761 and needed 100 to help. A naive Bayes model, already close to calibrated (error 0.023), was made worse by Platt scaling on fewer than 1000 rows and by isotonic regression on up to 5,000. Platt scaling never changed AUC; isotonic always lowered it. A model calibrated to 0.005 overall was off by 0.19 in a group holding 30% of the rows.
Episode 34 of Machine Learning, Taught Through What Breaks. The syllabus and the other episodes: https://jongha-jeon-dev.github.io/standarderror/lectures/
A second model for the first one’s probabilities
Episode 33 found that distance means less than the column count suggests, and sometimes more. Probabilities are the other number a model hands over to be trusted. Episodes 14 and 25 met models whose probabilities were too confident: boosting that overfitted its log loss, dropout’s weight scaling that dropped its doubts. The standard repair is recalibration, and the sentence under test is how it is usually presented: Platt scaling or isotonic regression fixes a model’s probabilities.
Both methods fit a second, small model on held-out rows that maps the first model’s score to a probability. Platt scaling fits a logistic curve to the score’s logit: two parameters. Isotonic regression fits any non-decreasing step function: as many parameters as the data allow. Both need rows the first model did not train on, and the question is how many.
On episode 4’s simulated task, two models trained on 2,000 rows are recalibrated on fresh sets of 50 to 5,000 rows, twenty times at each size, and scored on 20,000 test rows:
from standarderror.ml import around

c = around.calibration_size()        # 20 calibration sets per size
for name, row in c.items():
    print(f"{name}: uncalibrated log loss {row['raw']['nll']:.3f}, "
          f"calibration error {row['raw']['ece']:.3f}")
    for p, i in zip(row["platt"], row["isotonic"]):
        print(f"   {p['n']:5d} rows   Platt {p['nll']:.3f}   "
              f"isotonic {i['nll']:.3f}")
naive Bayes: uncalibrated log loss 0.626, calibration error 0.023
      50 rows   Platt 0.647   isotonic 0.788
     100 rows   Platt 0.637   isotonic 0.718
     200 rows   Platt 0.630   isotonic 0.672
     500 rows   Platt 0.626   isotonic 0.644
    1000 rows   Platt 0.625   isotonic 0.633
    5000 rows   Platt 0.624   isotonic 0.627
boosted trees: uncalibrated log loss 0.748, calibration error 0.157
      50 rows   Platt 0.612   isotonic 0.761
     100 rows   Platt 0.591   isotonic 0.675
     200 rows   Platt 0.587   isotonic 0.625
     500 rows   Platt 0.585   isotonic 0.603
    1000 rows   Platt 0.583   isotonic 0.594
    5000 rows   Platt 0.582   isotonic 0.584
The boosted trees start badly calibrated, with an expected calibration error of 0.157. Platt scaling on just 50 rows takes their log loss from 0.748 to 0.612. Isotonic regression on the same 50 rows makes it worse, 0.761, and only starts to help at 100 rows. At every size Platt scaling does better than isotonic.
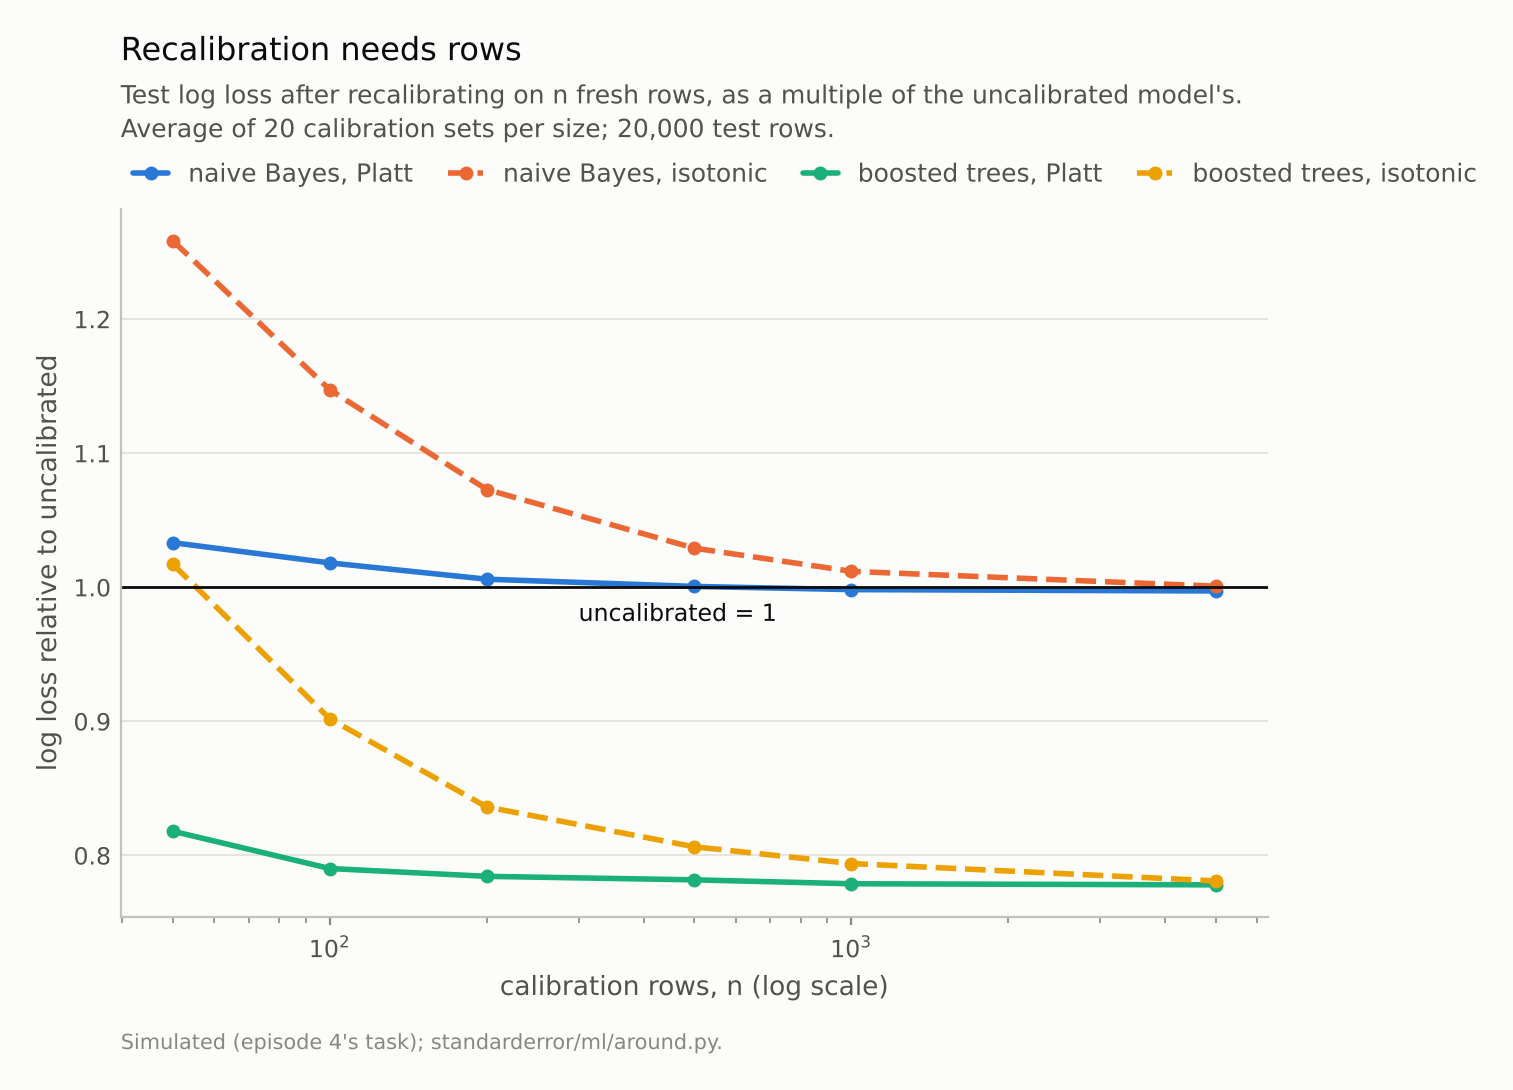
Boosted trees: Platt helps from 50 rows, isotonic from 100. Naive Bayes, already calibrated: Platt helps only from 1000 rows, isotonic not at all up to 5,000.
When there is nothing to fix
The naive Bayes model starts nearly calibrated, with an error of 0.023. Recalibrating it can only help a little, and estimating the correction costs something. On 50 rows Platt scaling raises its log loss from 0.626 to 0.647; it needs 1000 rows before it improves on doing nothing, and then by 0.0010. Isotonic regression is worse than doing nothing at every size up to 5,000 rows, where it still costs 0.0005.
The reason is the usual one for any fitted model: variance. A correction estimated from 50 rows is noisy, and applying a noisy correction to probabilities that were already right moves them away from right. Isotonic regression, with its many free steps, is noisier than Platt’s two parameters, which is why Niculescu-Mizil and Caruana recommended Platt scaling for small calibration sets and isotonic only when there are thousands of rows. The measurement agrees and adds a point that is easy to miss: recalibration is not free even when it is unnecessary, so check the calibration first.
Recalibration also touches ranking. Platt scaling is a monotone map, and the AUC after it is identical to the uncalibrated AUC at every size. Isotonic regression maps ranges of scores to the same value, creating ties, and lowered AUC in every one of the 6 sizes for both models: to 0.7424 from 0.7558 for the boosted trees on 50 rows.
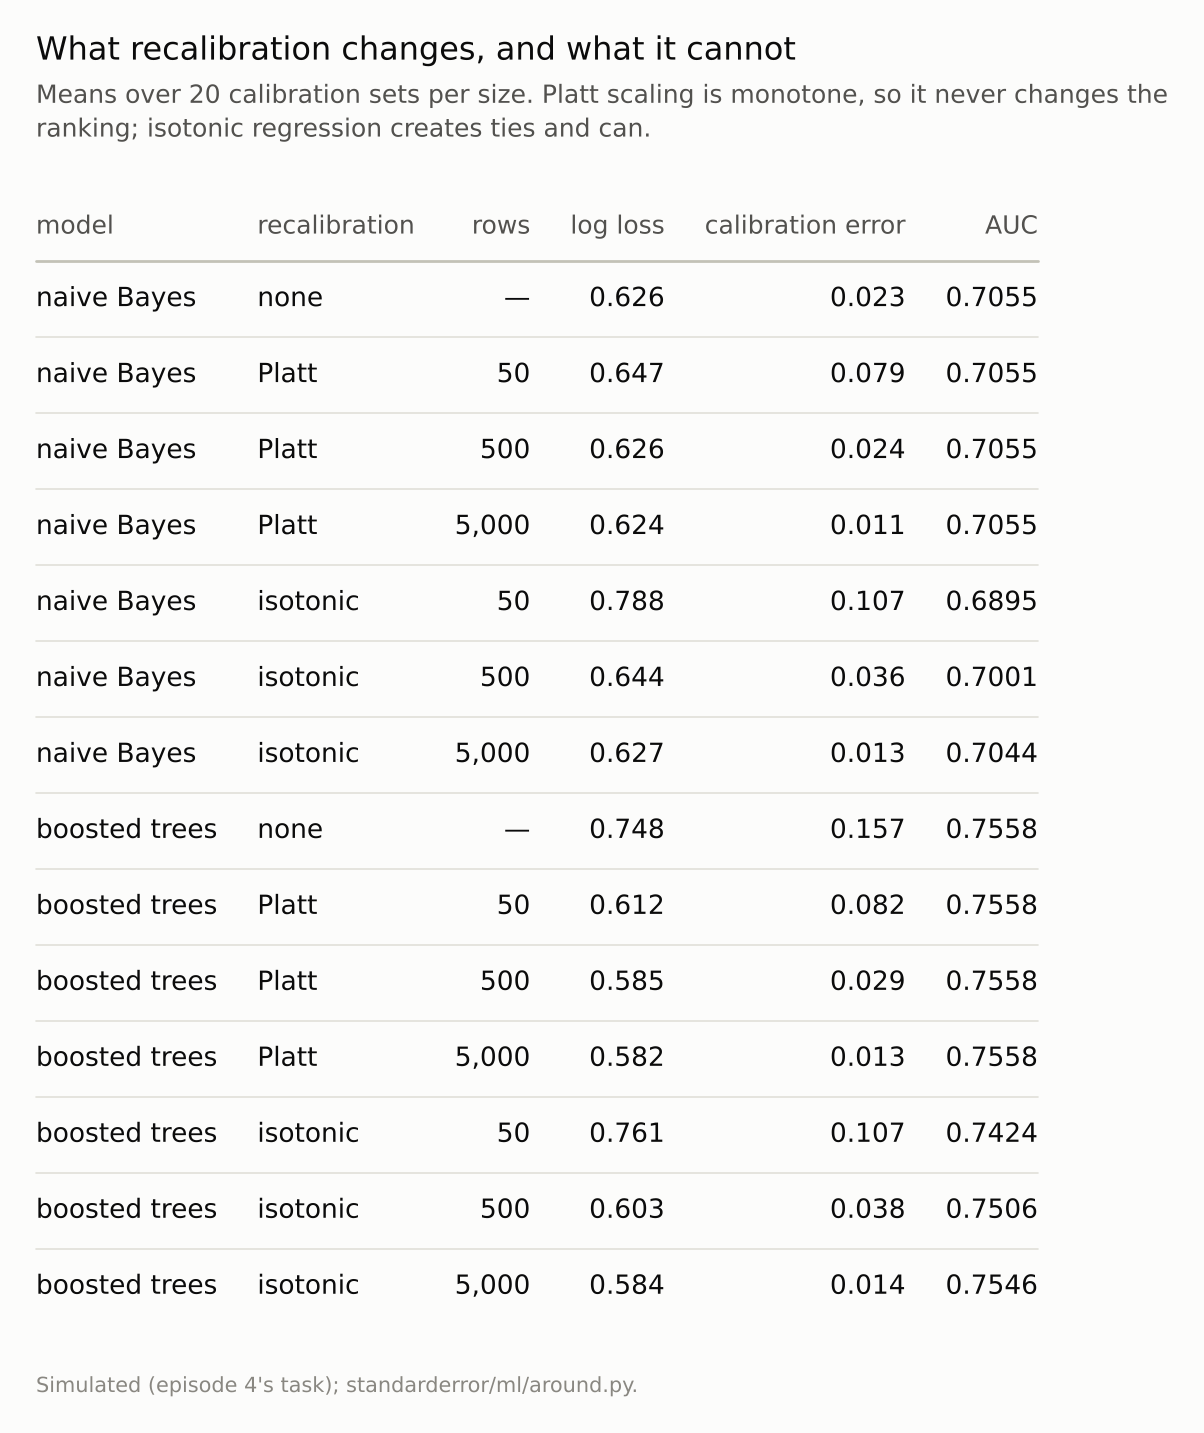
Platt scaling left AUC exactly as it was. Isotonic regression lowered it, most on small calibration sets.
The number people check
Log loss is the honest score for probabilities, but the number usually reported is the calibration error: the gap between predicted and observed rates, averaged over bins of the prediction. It tells the same story with larger swings.
For the boosted trees, calibration error falls from 0.157 uncalibrated to 0.082 after Platt scaling on 50 rows and 0.013 on 5,000; isotonic regression gets to 0.107 and 0.014. For the naive Bayes model the direction reverses at the small end: from 0.023 uncalibrated to 0.079 after Platt scaling on 50 rows, 3.4 times worse, and 0.107 after isotonic regression.
There is a structural reason the error cannot reach zero on a finite calibration set. The correction is estimated from the calibration rows’ noisy labels, so with n rows the fitted map is off by roughly one over the square root of n in each bin it has to fill. Two parameters spread that noise thinly; a step function with a step wherever the data allow concentrates it. The calibration set has to be large compared with the precision the probabilities are expected to have, and a few hundred rows buy precision of a few hundredths at best.
Calibrated on average
The deeper limit has nothing to do with sample size. A calibration curve compares predicted and observed rates across all rows; calibration in that sense is a property of the average. Two groups with different base rates, a model that sees a shared feature but not the group:
g = around.subgroup_calibration()
print(f"calibration error, all rows: {g['blind']['all']:.3f}")
for grp in g["groups"]:
    k = grp["group"]
    print(f"group {k} ({grp['share']:.0%} of rows): true rate "
          f"{grp['rate']:.3f}, mean prediction {grp['blind_mean']:.3f}, "
          f"error {g['blind'][k]:.3f}")
calibration error, all rows: 0.005
group 0 (70% of rows): true rate 0.399, mean prediction 0.481, error 0.083
group 1 (30% of rows): true rate 0.669, mean prediction 0.478, error 0.191
Over all rows the model is calibrated to 0.005: when it says 0.6, about 60% of rows are positive. Within the smaller group, 30% of the rows, its error is 0.191: it predicts 0.48 on average for a group whose rate is 0.67, and in the larger group it predicts 0.48 for a rate of 0.40. The errors cancel in the overall average.
No recalibration of the model’s score can fix this, because the score is the same function of the feature in both groups and any monotone correction moves both groups’ predictions the same way. What fixes it is information: the same logistic model given the group is calibrated to 0.005 and 0.007 within the groups. Hébert-Johnson and colleagues call calibration that holds within every identifiable subgroup multicalibration, and it is a property of the model and its inputs, not of a post-hoc correction.
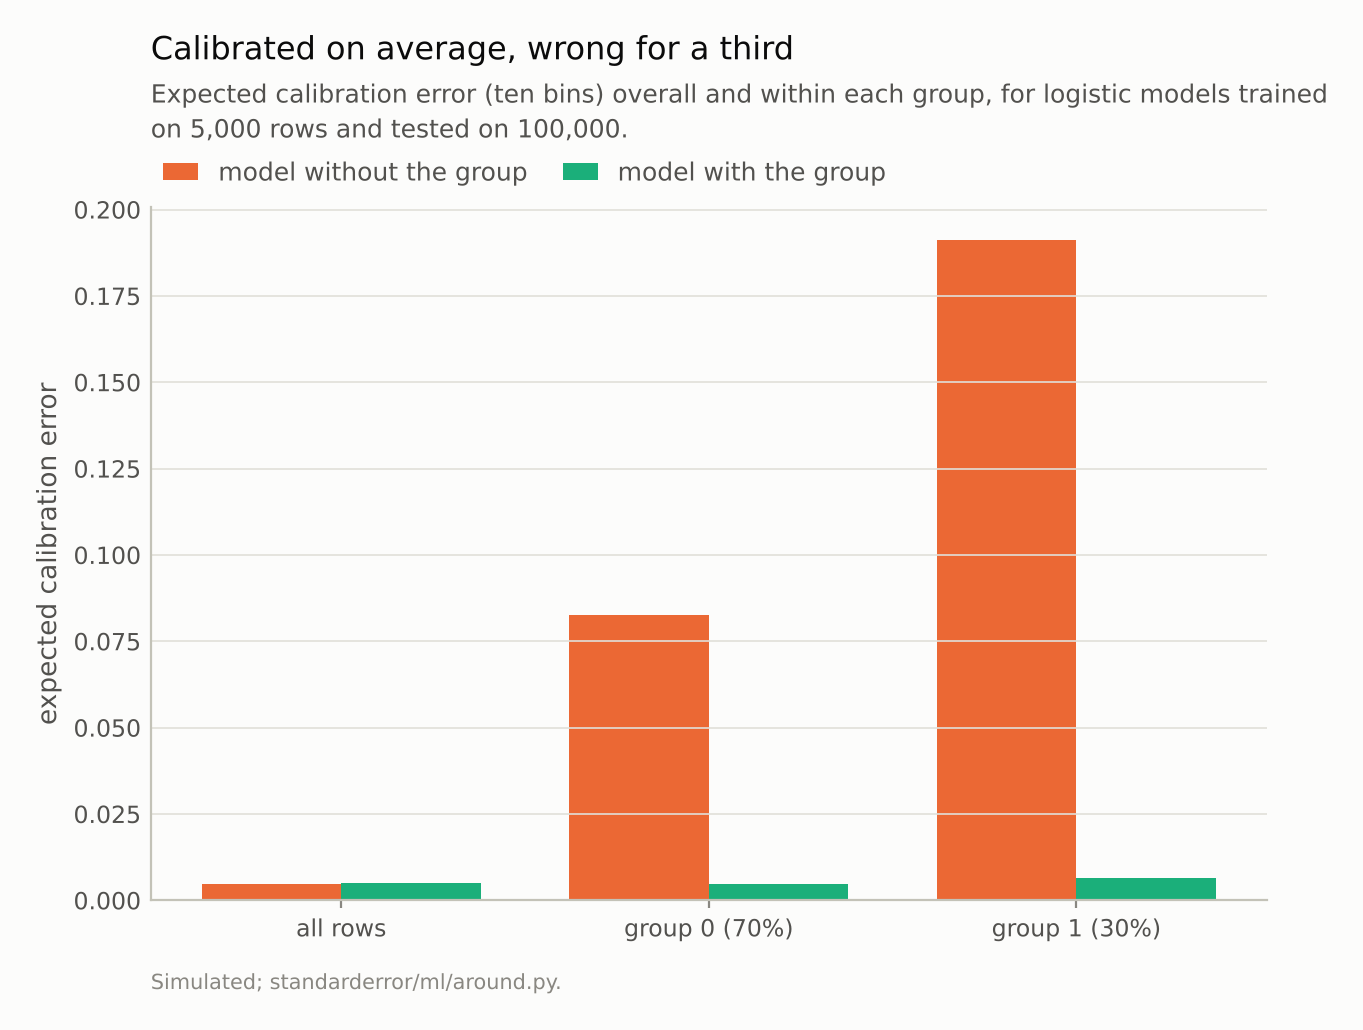
Overall calibration error 0.005; in the smaller group, 0.191. The group’s true rate is 0.67, the model’s mean prediction 0.48.
Where this breaks
One task, two models. The row counts at which recalibration starts to help depend on how badly calibrated the model is and how noisy the task is. The order (Platt before isotonic on small sets, check before correcting) is what transfers.
Calibration sets drawn fresh. In practice the calibration rows are often a slice of the training data, or the validation set already used for tuning, which adds its own optimism.
Expected calibration error is binned. Ten equal-width bins; with other binning the numbers move a little. Log loss, which needs no bins, tells the same story here.
Two groups, known. Real subgroups are many, overlapping and often unrecorded. Calibration within the groups one can name is a lower bound on the problem.
What to keep
Recalibration is a fitted model, with variance. On 50 rows Platt scaling cut an overconfident model’s log loss from 0.748 to 0.612; isotonic regression raised it to 0.761.
Recalibrating a model that is already calibrated makes it worse until the calibration set is large: 1000 rows for Platt scaling here, more than 5,000 for isotonic.
Platt scaling leaves the ranking untouched; isotonic regression lowered AUC at every size.
Calibration is an average. A model calibrated to 0.005 overall was off by 0.19 in a third of the rows. Check calibration within the groups that matter, and fix it with information, not with a correction of the score.
Exercise
Take a classifier whose probabilities you use, and a held-out set. Plot its calibration curve overall, then separately for each value of a variable that matters to the decision (region, product, age band) that the model may or may not use.
If the overall curve is close to the diagonal and a group’s is not, recalibrating the score will not help that group. Then try Platt scaling on a quarter of your held-out rows and check, on the rest, whether log loss improved at all.
Next
Every model in these thirty-four episodes was chosen somehow: a learning rate, a depth, a number of components. Episode 35, the last of Arc VII, measures what choosing does to the score that justified the choice.
Data
- Simulated: episode 4’s two-class Gaussian task in 10 dimensions; models trained on 2,000 rows, calibration sets of 50 to 5,000 fresh rows (seeds 100 to 119), 20,000 test rows.
- Simulated: two groups (70% and 30%) with base logits −0.6 and +1.0 and a shared slope on one feature; 5,000 training rows, 100,000 test rows.
- Machinery:
standarderror/ml/around.py, tested intests/test_ml.py; scikit-learn’s GaussianNB, HistGradientBoostingClassifier (300 rounds), LogisticRegression for Platt scaling on the logit, IsotonicRegression; expected calibration error over ten equal-width bins. - Where this stops: Platt, “Probabilistic outputs for support vector machines” (1999); Zadrozny and Elkan, “Transforming classifier scores into accurate multiclass probability estimates”, KDD (2002); Niculescu-Mizil and Caruana, “Predicting good probabilities with supervised learning”, ICML (2005); Hébert-Johnson et al., “Multicalibration”, ICML (2018).
Reproducibility
- environment: standarderror=0.1.0, python=3.13.16, numpy=2.4.4
- code blocks: executed at build time; the values the prose quotes are pinned, so drift fails the build
- determinism: training rows seed 1, calibration sets seeds 100 to 119, test rows seed 99; group simulation seeds 0 and 1