Disclosure: this post was written with the assistance of an AI system (Claude), which wrote the analysis code, ran the experiments and drafted the text. The topic, the constraints, the data choices and the final review are the author’s.
A random forest on the diabetes data. Shuffling bmi costs 0.168 of test R²; refitting the forest without bmi costs 0.043, 4 times less. Add an exact copy of bmi and the permutation importances are 0.017 for bmi and 0.021 for the copy — together a quarter of what bmi had alone — while dropping bmi and keeping the copy costs nothing and dropping both costs 0.044, as before. Shuffling s1, correlated 0.90 with s2, puts 29% of rows outside the region that holds 99% of real (s1, s2) pairs.
Episode 16 of Machine Learning, Taught Through What Breaks. The syllabus and the other episodes: https://jongha-jeon-dev.github.io/standarderror/lectures/
Three questions with one name
Arc III ended with forests that predict well and resist being read. Arc IV is about reading them anyway, starting with the importance measure episode 12 recommended over impurity importance: shuffle one column of a held-out set, score the model again, and call the drop in performance the feature’s importance.
That is often described as “how much the model needs the feature”. There are at least three different questions hiding in that phrase. How much does this fitted model lean on the column? How much would a model refitted without it lose? How much information does the column carry that nothing else does? Permutation importance answers only the first, and it answers it on rows the shuffle invented.
The diabetes data and a random forest show the gap. bmi matters to this forest: shuffling it, as the first row below shows, removes about half of its test R² of 0.33. Add a second column that copies bmi with a chosen correlation, and measure four things:
from standarderror.ml import reading as rd

# random forest on diabetes; loss of test R^2, mean of 3 splits
for r in rd.copy_importance(rhos=(None, 0.8, 0.95, 1.0)):
    print(f"{str(r['rho']):>4}  permute bmi {r['feature']:.3f}"
          f"  permute copy {r['copy']:+.3f}"
          f"  refit w/o bmi {r['drop_feature']:.3f}"
          f"  w/o both {r['drop_both']:.3f}")
None  permute bmi 0.168  permute copy +0.000  refit w/o bmi 0.043  w/o both 0.043
 0.8  permute bmi 0.162  permute copy -0.001  refit w/o bmi 0.000  w/o both 0.047
0.95  permute bmi 0.115  permute copy +0.009  refit w/o bmi 0.004  w/o both 0.041
 1.0  permute bmi 0.017  permute copy +0.021  refit w/o bmi 0.000  w/o both 0.044
Start with the first row, no copy. Shuffling bmi costs 0.168 of test R². Refitting the forest without bmi costs 0.043, 4 times less. Both are correct; they measure different things. The fitted forest has organised itself around bmi and is badly hurt when bmi is scrambled. A forest grown without bmi loses only a little — presumably because it finds much of the same information in the other measurements, though which ones carry it was not measured here.
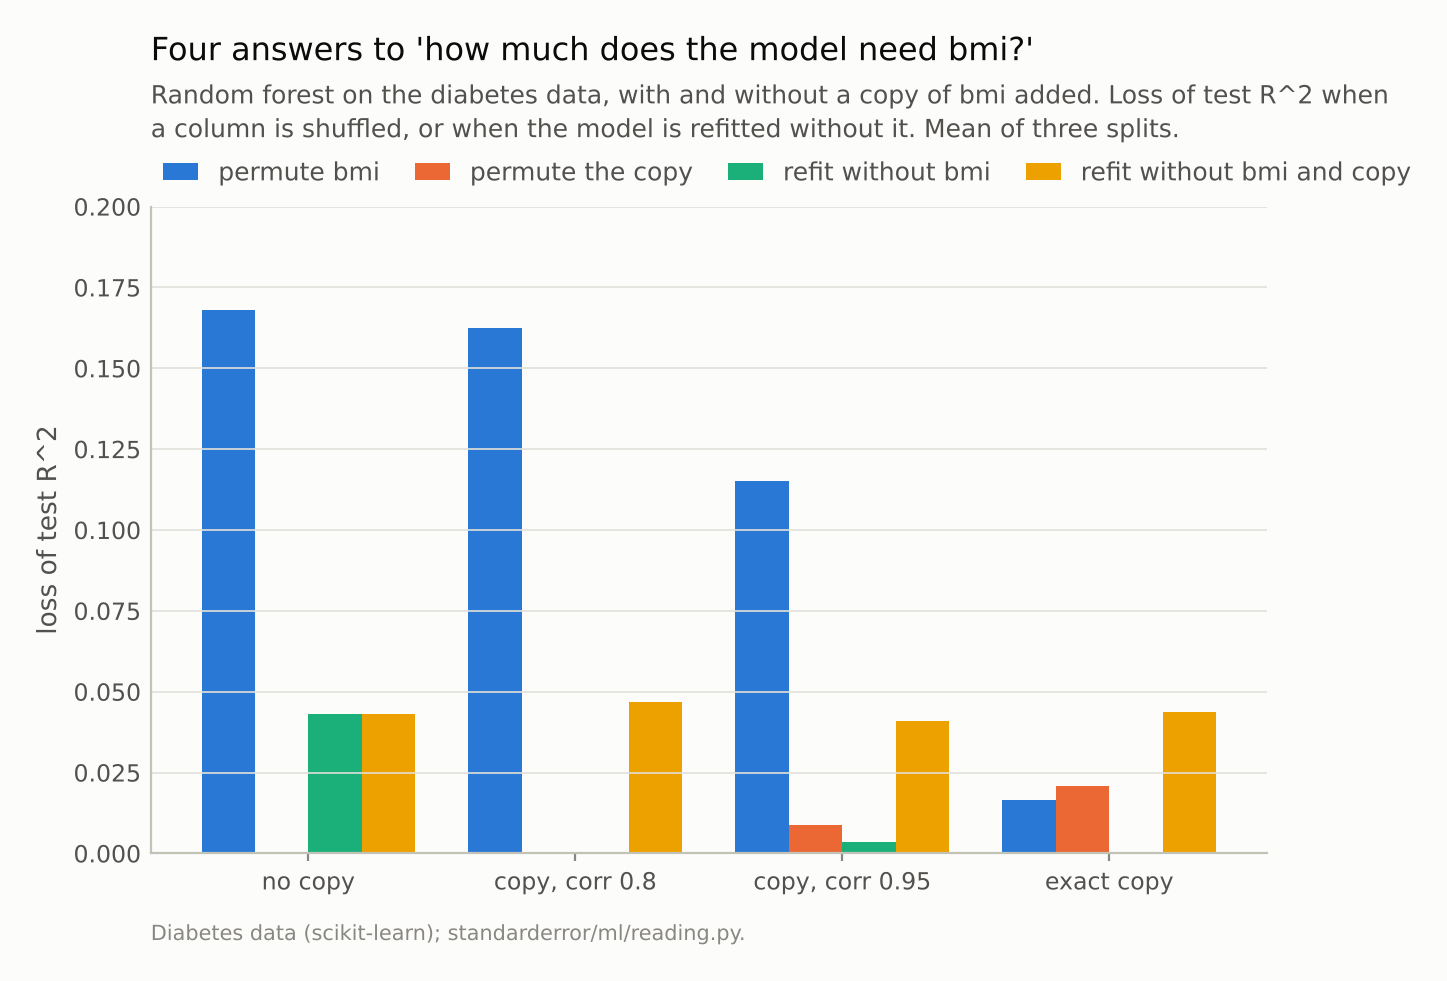
Alone, shuffling bmi costs 0.168 and refitting without it 0.043. With an exact copy, shuffling either costs about 0.02; removing bmi and keeping the copy costs nothing, and removing both costs 0.044.
A copy hides the original
Now add the copy. With an exact duplicate, the two columns offer identical splits, so which one a node uses comes down to tie-breaking, and the forest’s reliance is presumably divided between them. Shuffle one and the splits on the other still work. Permutation importance falls to 0.017 for bmi and 0.021 for its copy. Their sum, 0.038, is a quarter of what bmi had alone: permutation importance is not even additive over copies.
Refitting tells the same story differently. Remove bmi and keep its copy, and nothing is lost (0.000). Remove both and the loss is 0.044, the same as removing bmi when there was no copy. That last column is stable across every row of the table — averaged over the same three splits, the information bmi carries is worth about 0.04 of R² however it is presented — while the permutation numbers move by a factor of ten.
Real tables are full of near-copies: total cholesterol and LDL, height and weight, a price and the same price in another currency, a date and the age computed from it. A pair close enough can split its permutation importance between its members and push both down a ranking. How close is close enough is in the table: at a correlation of 0.8 the forest still leaned almost entirely on the original, and the copy’s importance was -0.001; at 0.95 the copy took 0.009 against bmi’s 0.115; only the exact copy split it evenly. Episode 12’s breast-cancer run had three real measurements with permutation importance at or below zero, which is what this effect would produce, though that run did not check the cause.
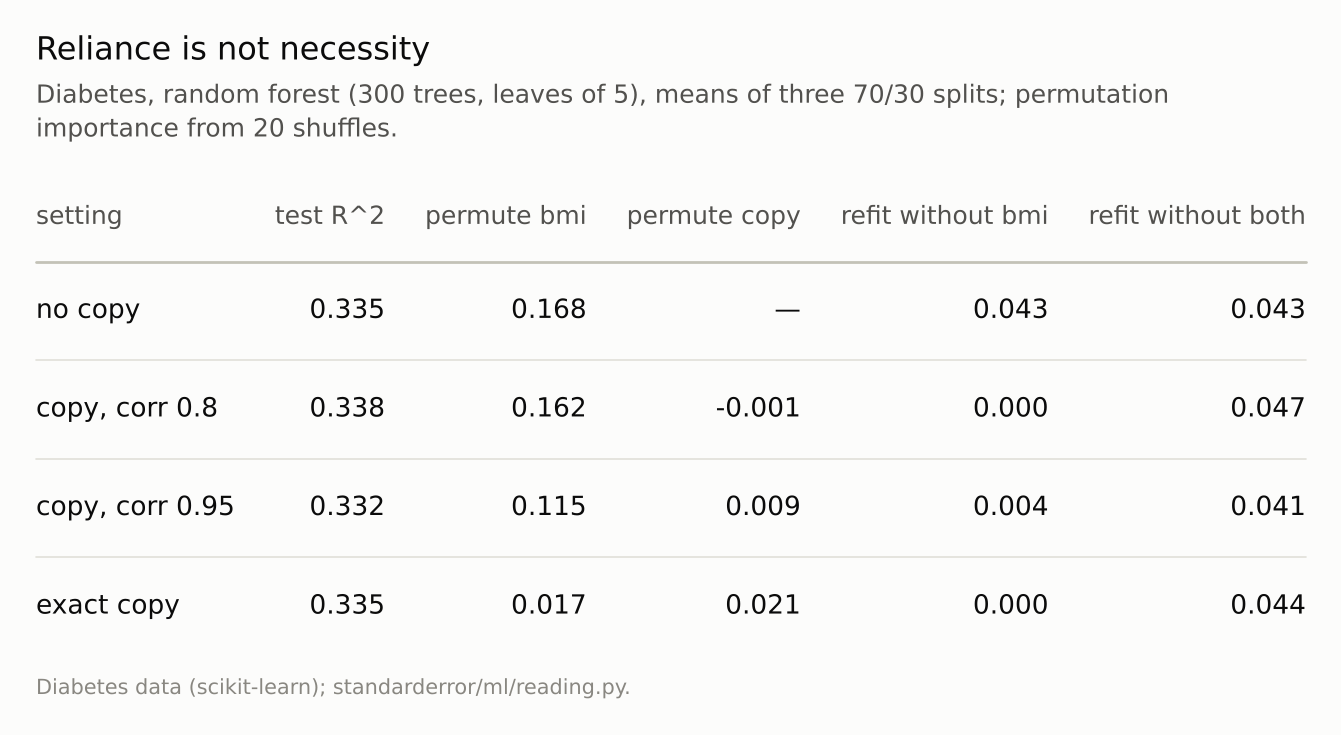
The last column barely moves: the information in bmi is worth about 0.04 of R² in every setting. The permutation columns move by a factor of ten.
Rows that do not exist
There is a second problem, and it does not need a copy. Shuffling a column breaks its relationship with every other column. When features are correlated, the shuffled rows are combinations no patient has.
o = rd.off_support(a="s1", b="s2", level=0.99)
print(f"corr(s1, s2) = {o['corr']:.2f}")
print(f"after shuffling s1, {o['outside']:.1%} of rows fall outside "
      f"the region holding 99% of real pairs")
corr(s1, s2) = 0.90
after shuffling s1, 29.0% of rows fall outside the region holding 99% of real pairs
In the data, s1 and s2 — total cholesterol and LDL — move together closely. After s1 is shuffled, 29% of rows lie outside the region holding 99% of real pairs, where only 1% would by chance. A patient with very high total cholesterol and very low LDL is not a patient anyone measured. The forest’s prediction there is whatever its nearest leaves say, and permutation importance scores the forest on those predictions.
So part of what permutation importance measures is how badly the model extrapolates off the data, which is a property of the model’s behaviour in a region it was never trained on. Hooker, Mentch and Zhou (2021) make this the central objection; conditional permutation, which shuffles a feature only among rows with similar values of the others, keeps the rows on the data at the cost of more computation and more choices.
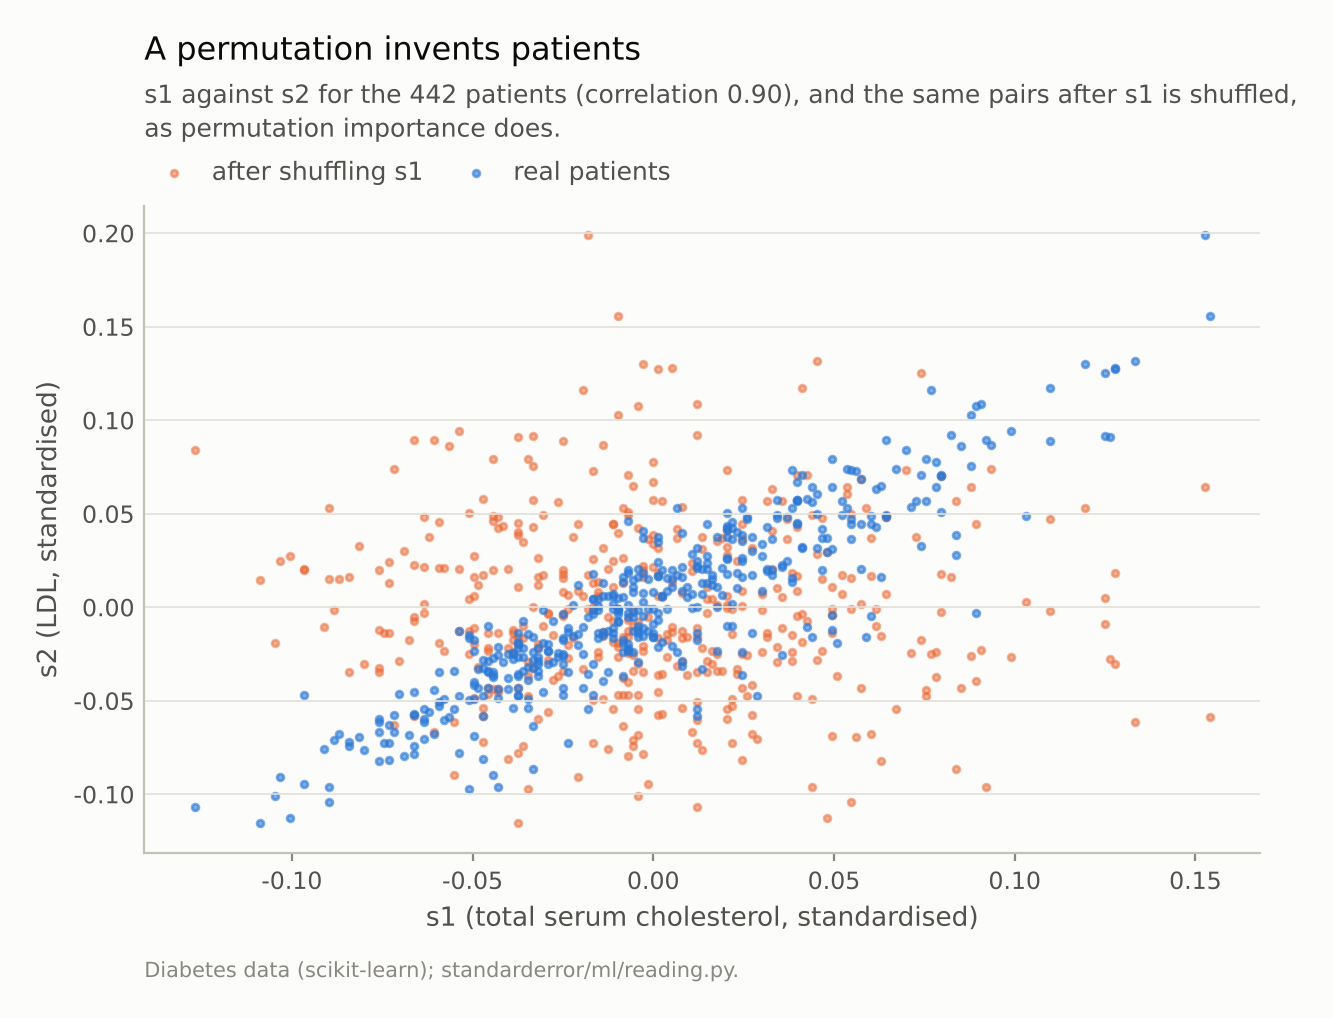
29% of shuffled rows lie outside the ellipse that holds 99% of real pairs. The model is scored on what it predicts for them.
Asking a better question
If permutation importance answers the narrowest of the three questions, the fix is to ask a wider one deliberately, and the table already contains the answer to it. Removing bmi and its copy together and refitting cost 0.044 of R², within a hundredth of the 0.043 that removing bmi cost when it had no copy. Measured as a group, the information is stable: duplicated, nearly duplicated or alone, it is worth the same.
That suggests a working procedure. Cluster the features by correlation first — a simple threshold on the absolute correlation is enough to start. Report importance for each cluster, by permuting all its members together or by refitting without the whole cluster. Within a cluster, say which member the model happened to lean on, and say that a different fit could lean on another. Permuting a whole cluster should also leave fewer impossible rows behind, since its members move together and keep their relationship to one another; what is broken is only their relationship to everything else. That was not measured here.
None of this makes importance a causal statement. A group of features that predicts well may be a proxy for something else entirely, as episode 19 will show with a single pixel. It does make the ranking a property of the information in the data rather than of which column the forest’s random splits happened to favour.
Where this breaks
Refitting has its own question. Drop-column importance measures what the data lose without a feature, given the model class. It is expensive — one refit per feature — and it assigns zero to every member of a group of near-copies, which is equally misleading in the other direction. The honest unit is often the group.
R² on 133 test patients is noisy. The numbers are averages of three splits, and single splits differ a lot: test R² ranged from 0.26 to 0.42, and the loss from refitting without bmi from -0.07 to +0.13. The direction held in every split — permuting bmi always cost more than refitting without it — but the size of the drop-column numbers, here and in the table, is uncertain to about a tenth of R².
Other models distribute reliance differently. A linear model with an exact copy has no unique coefficients at all, and neither does a lasso: any split of the coefficient between the two columns with the same sign has the same penalty, so the answer depends on the solver. With near-copies, episode 8 found the lasso’s choice between the two varying from fit to fit. Permutation importance inherits whatever the fitting procedure did.
A copy is the extreme case. At correlation 0.8 the forest still prefers the original and the copy’s permutation importance is near zero; at 0.95 the copy starts to take a share, and the original still dominates. Most real pairs sit somewhere in between, and so does the distortion.
What to keep
Permutation importance measures how much one fitted model leans on a column, not how much the outcome depends on it or how much the data would lose without it.
On diabetes, shuffling bmi cost 0.168 of R²; refitting without it cost 0.043.
With an exact copy, the two columns’ permutation importances summed to 0.038, a quarter of bmi’s alone. Exact copies hide each other; at a correlation of 0.8 the effect had not yet appeared.
Shuffling a correlated feature invents rows: 29% of shuffled (s1, s2) pairs lay outside the 99% region of real ones.
Group correlated features before computing importance, and report what is lost when the group is removed, not each member’s share.
Exercise
Compute permutation importance for your model and, for its top five features, the importance when each is removed and the model refitted. Where the two disagree by more than a factor of two, list the features most correlated with the one in question.
Then pick your most strongly correlated pair, shuffle one of them in a copy of your test set, and plot the pair before and after. Count the shuffled rows that lie outside the real cloud. That is the share of the importance score computed on data no one has seen.
Next
Episode 17 moves from how much a feature matters to how the prediction depends on it, and to the partial dependence plot — which builds its curve out of exactly the kind of invented rows measured here.
Data
- Diabetes data of Efron et al. (2004), as bundled with scikit-learn: 442 patients, 10 baseline variables; three 70/30 splits; a copy of bmi added as rho·bmi + sqrt(1 - rho²)·noise with the noise scaled to bmi’s spread.
- Machinery:
standarderror/ml/reading.py, tested intests/test_ml.py; scikit-learn’s RandomForestRegressor (300 trees, leaves of 5) and permutation_importance (20 shuffles). - Where this stops: Breiman, “Random forests”, Machine Learning (2001); Strobl et al., “Conditional variable importance for random forests”, BMC Bioinformatics (2008); Hooker, Mentch and Zhou, “Unrestricted permutation forces extrapolation”, Statistics and Computing (2021).
Reproducibility
- environment: standarderror=0.1.0, python=3.13.16, numpy=2.4.4
- code blocks: executed at build time; the values the prose quotes are pinned, so drift fails the build
- determinism: splits from seeds 0 to 2; copies’ noise from seeds 100 to 102; forests seeded with the split seed; permutations with seed 0